To model a sales compensation plan before launch, test it five ways: back-test it against last year's actual results, run scenario and sensitivity analysis, simulate thousands of possible years with Monte Carlo, test the payout curve and edge cases, and stress-test it with real people and a shadow run in your comp system. Each method catches a different risk.
Who this is for: Sales compensation leaders, comp admins, Sales Operations, and Finance partners who have a new or redesigned incentive plan on paper and need to know what it will cost and how it will behave before reps see it.
A comp plan that looks right in a design workshop can still overpay a handful of reps, underpay the middle of the team, or blow through budget the moment a big quarter lands. Based on our experience across 300+ sales performance management (SPM) implementations at Blue Horizons Group (BHG), the plans that cause the most trouble after launch are rarely badly intended. They are the ones nobody ran the numbers on.
Modeling is how you find those problems while they are still cheap to fix. This guide covers the five methods we use with clients: what question each one answers, how to run it step by step, and where each one can mislead you. A comparison table near the end helps you decide which methods your plan actually needs.
What is sales compensation plan modeling?
Sales compensation plan modeling is the practice of running a proposed incentive plan against real and simulated performance data to predict what it will pay, who it will pay, and how it will behave before it goes live. It turns a plan document into numbers that Sales, Finance, and HR can test together. A useful model answers three questions: what will this plan cost, is that cost distributed fairly, and will the plan hold up when the year doesn't go to forecast.
Modeling sits between plan design and plan launch. It is one of the most important comp plan design best practices because it catches problems while the plan is still a draft, not after reps have signed their plan documents.
Why does modeling a comp plan matter?
A plan that skips modeling tends to surface its problems in the first quarter, through payout disputes, exception requests, and budget conversations. Each of those costs credibility as well as money; reps who don't trust their payouts start shadow accounting.
Shadow accounting is when sales reps or managers keep their own spreadsheets to track and check their commissions because they don't trust the official numbers. It pulls time away from selling, and it is one of the clearest signs that a plan or its payouts have lost credibility. Modeling reduces it at the source by making sure the plan pays what people expect for the results they deliver.
What do you need before you start modeling?
You need five inputs before any modeling method will produce numbers worth acting on:
- A draft plan with every mechanic written out. Measures, weights, quotas, rates, thresholds, accelerators, caps, and crediting rules.
- Clean performance data by rep. At least 12 months of actuals for every measure, pulled from the same source systems your ICM uses. Monte Carlo simulation needs two to three years.
- A current roster with target incentive and pay mix by role. Target incentive compensation (TIC) is the anchor for nearly every comparison you'll make.
- Cost guardrails agreed with Finance. A budget ceiling, an acceptable range, and usually a cost of sales target (total incentive cost as a percentage of revenue). Agree on these before you model so the results have something to be judged against.
- An owner and a tool. A spreadsheet handles back-testing and payout curves well for most teams. Monte Carlo simulation and large populations usually call for a statistical tool or the modeling capability in your ICM (incentive compensation management) platform.
A simplified example we'll follow throughout
To make each method concrete, this guide follows one illustrative example. A B2B software-as-a-service (SaaS) company is redesigning the plan for 80 account executives, each with a $50,000 target incentive. The new plan pays 70% on annual recurring revenue (ARR) bookings against quota and 30% on new logos, with a threshold at 50% of quota, a 1.5× rate above 100%, and a cap at 250%.
At 100% attainment for everyone, the plan would cost $4.0 million. Finance has set a budget of $4.25 million. The figures are invented for illustration, not client data, but the patterns they reveal are ones we see regularly in high tech sales compensation.
Method 1: How do you back-test a sales comp plan?
Historical back-testing answers one question: if this plan had been in place last year, who would have earned what? It is the simplest modeling method and the one every plan redesign should start with.
How to run a back-test
- Pull 12 months of actual performance by rep for every measure. Use the same source systems your ICM uses, not a summary report or a manager's spreadsheet. If the model and the ICM start from different data, you'll spend the run explaining differences that have nothing to do with the plan.
- Run each rep's actual results through the new plan mechanics. Apply the new quotas, weights, rates, thresholds, and caps exactly as written in the draft plan document.
- Compare new payouts to actual prior-year payouts by rep, role, and region. Look at the totals and at the distribution. A plan can hit the same total cost while moving money from one group to another.
- Sort reps into winners, losers, and neutral. Investigate any swing over 10% to 15% in either direction.
- Total the cost and compare it to budget. Report it next to the prior-year actual cost and the Finance guardrail.
What a back-test reveals
The winner and loser list is the most valuable output. It shows whether the plan rewards the behaviors you designed it to reward, and it gives sales leaders a preview of the conversations they'll have when the plan rolls out. If your top performer by bookings turns out to be the biggest loser, you want to know that prior to launch, not two months into the new plan.
In our SaaS example, the back-test puts total cost at $4.12 million, within the $4.25 million budget. The distribution tells a different story. Eleven reps lose more than 15% of last year's pay, and nine of them cover the strategic accounts segment, where most bookings come from expanding existing customers. The 30% new-logo weight is penalizing their book of business, not their effort.
That finding doesn't mean the new-logo measure is wrong. It means the plan may need different weights by segment, such as a smaller new-logo weight for strategic account executives, before it's fair to everyone it covers.
Watch out for: a back-test assumes behavior stays the same
A back-test tells you what last year's behavior would have earned under next year's plan. But a new plan exists to change behavior, and reps will respond to it. Treat the back-test as a baseline, not a forecast. The other four methods test what happens when results and behavior move.
Method 2: How do you run scenario and sensitivity analysis on a comp plan?
Scenario and sensitivity analysis tests how a comp plan's cost and payouts change when the year goes better or worse than expected, and which plan inputs drive the most change. It answers the question: what if the year goes better or worse, and which levers matter most? It is the method Finance usually asks for first, because it puts a range around the budget number.
Scenarios and sensitivity are two related techniques. A scenario moves overall performance up or down. A sensitivity test holds performance steady and changes one plan input at a time to see how much each one matters.
How to run scenario and sensitivity analysis
- Start from the back-test or forecast as your base case. Everything else is measured against it.
- Build base, upside, and downside scenarios. A common starting point is attainment up or down 15% across the population. If your business has known swing factors, such as a major product release or a soft market in one segment, build those as named scenarios too.
- Change one input at a time and record the effect on cost and average payout. Typical inputs are the rate above quota, the threshold, the cap, measure weights, and quota levels.
- Rank inputs by impact. A tornado chart, which shows each input as a horizontal bar sized by its effect on cost and sorted largest to smallest, makes the ranking easy for leadership to read at a glance.
- Check every scenario against the cost guardrails agreed with Finance. Flag any scenario that breaks the budget ceiling or the cost of sales target, and decide in advance whether that outcome is acceptable.
What scenario and sensitivity analysis reveals
The scenarios show whether the plan's cost moves in proportion to results. A well-built plan should cost more in a great year, because the company earns more. The question is whether incentive cost grows faster than the revenue that funds it.
In the SaaS example, the base case costs $4.12 million. In the upside scenario, with attainment up 15%, cost rises to about $5.1 million, roughly 24% higher, because more reps cross 100% and start earning at the 1.5× rate. That breaks the $4.25 million budget. In the downside scenario, cost falls to about $2.9 million.
The sensitivity tests explain why. The rate above quota is by far the biggest lever on cost. The threshold comes second. The 250% cap barely moves the base case, because almost no one reaches it, but it matters a great deal in the upside scenario. That ranking tells the design team exactly where to focus: test a lower accelerator, or a step-up that starts at 110% instead of 100%, before touching anything else.
Watch out for: real years rarely move one variable at a time
Sensitivity analysis isolates each input so you can see its effect, but a real year moves several things at once. Bookings rise while new logos lag, or one segment surges while another stalls. Use sensitivity to find the two or three biggest levers, then test those levers together in combined scenarios. For a probability-based view of how often each outcome is likely to happen, use Monte Carlo simulation.
Method 3: How does Monte Carlo simulation work for sales compensation?
Monte Carlo simulation estimates the range and likelihood of comp plan costs by running the plan thousands of times against randomly generated, realistic attainment for every rep. It answers the question: how confident are we in this cost estimate? Instead of one budget number, it gives Finance a probability, such as a 20% chance of exceeding budget.
Scenario analysis tells you what happens if attainment rises 15%. Monte Carlo tells you how likely that is, and what the full spread of outcomes looks like.
How to run a Monte Carlo simulation on a comp plan
- Pull two to three years of attainment history and study its shape. Plot how many reps landed at each attainment level. Look at the middle, the spread, and the tails.
- Choose a distribution that fits your history. Many sales populations skew rather than follow a bell curve: most reps cluster below or near quota, while a smaller group runs well above it. A normal distribution will understate those high performers, and they are exactly where accelerators make cost climb.
- Generate random attainment for each rep, run it through the plan, and record total cost. Repeat 1,000 to 10,000 times. Each run is one possible year.
- Report ranges, not a single number. The three figures leadership needs are the median cost, the 90th percentile cost, and the probability of exceeding budget.
- Rerun alternate designs to compare risk, not just averages. Two plans can have the same median cost and very different chances of blowing the budget.
What a Monte Carlo simulation reveals
In the SaaS example, 10,000 simulated years put the median cost at $4.10 million, close to the back-test. The 90th percentile is $4.60 million, and the plan exceeds the $4.25 million budget in 34% of simulated years. That is a much more useful conversation for a CFO than "we expect $4.12 million."
The design team then reruns the simulation with the rate above quota reduced from 1.5× to 1.3×. The median drops only slightly, to $4.03 million, but the 90th percentile falls to $4.33 million and the chance of exceeding budget drops to 20%. The change barely affects a typical year. It mainly cuts off the expensive tail, which is often exactly what Finance is worried about.
One practitioner detail matters a lot here. If you draw every rep's attainment independently, the simulation will assume good and bad luck cancel out across the team. In real life, a strong market or a well-received product release lifts most reps at once. Build in a shared market factor, or correlate attainment by segment, so the simulation reflects the years when everyone has a great quarter together.
Watch out for: the output is only as good as the history behind it
Monte Carlo looks precise, which makes it easy to over-trust. If territories, roles, products, pricing, or quota methodology changed since the history was recorded, the old distribution no longer describes the new plan. Adjust the inputs to reflect those changes, document the assumptions, and present results as ranges with those assumptions stated.
Method 4: How do you test a comp plan's payout curve and edge cases?
Payout curve and edge case testing checks that a comp plan pays a sensible, explainable amount at every level of performance and in the unusual situations real sales years produce. It answers the question: does the plan behave sensibly at every point on the curve? Back-testing, scenarios, and Monte Carlo look at the whole population; this method looks at individual payouts, one at a time.
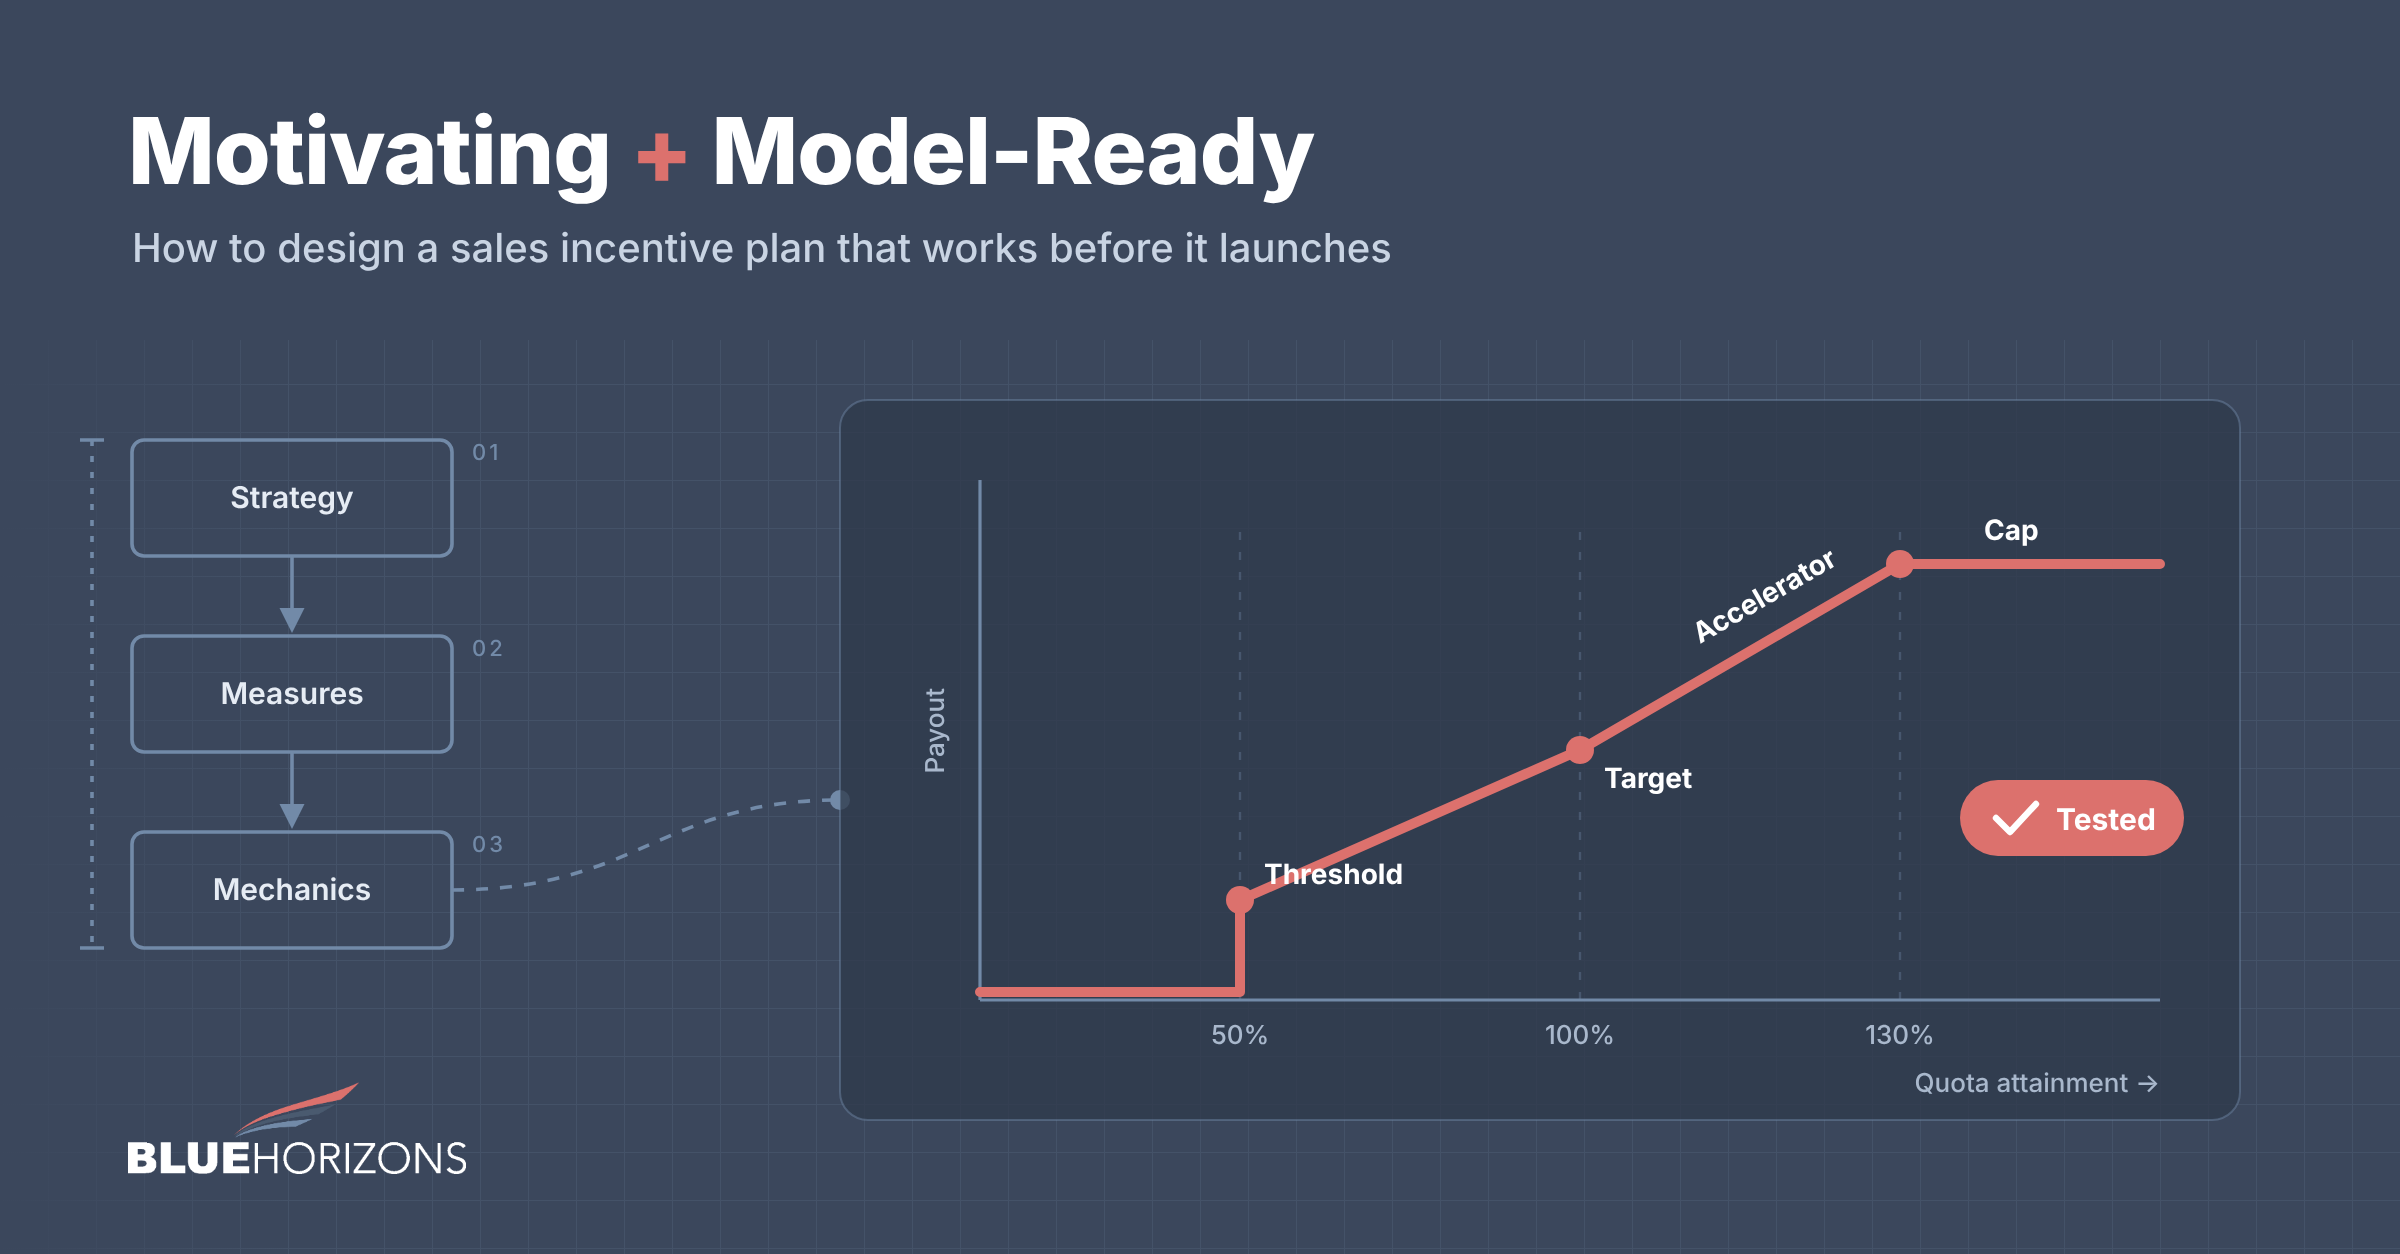
The payout curve is the line that shows payout as a percentage of target incentive against attainment as a percentage of quota. Thresholds, accelerators, decelerators, and caps all show up as changes in its slope. Problems that are invisible in a plan document are often obvious on a chart.
How to test the payout curve and edge cases
- Build sample performers at 0%, 50%, threshold, 100%, 125%, 150%, 200%, and 250% or more of quota. If your threshold isn't at 50%, test just below it and just above it.
- Chart payout against attainment. Look for cliffs (a big jump in pay for a tiny gain in performance), flat spots (more performance, no more pay), unexpected steps, and uncapped exposure.
- Add real-world cases. A mid-year hire, a territory transfer, a windfall deal, a large cancellation or reversal, and a split deal. Add the cases that are specific to your business, too.
- Confirm each payout is one you could explain to the rep and defend to Finance. If you can't explain a payout in two sentences, the rep won't be able to either.
- Document the results. They double as ICM test scripts later.
What payout curve and edge case testing reveals
In the SaaS example, the chart shows a cliff right at the threshold. As drafted, the ARR component pays 50% of its target at 50% attainment and nothing below it. A rep at 49.9% earns $0 on ARR, while a rep at 50% earns $17,500. That gap invites end-of-quarter pressure to pull deals forward with discounts, and it guarantees an argument over every rep who lands just short.
The chart also shows that the 250% cap applies only to the ARR component. The new-logo component is uncapped, which the population-level methods missed because so few reps reach those levels.
The real-world cases add three more findings, all common in SaaS. A parent company that signs separate contracts for six subsidiaries would count as six new logos and push one rep past 400% on that measure. A multi-year deal with ramped pricing could be credited at its first-year ARR or its average annual value, and the draft doesn't say which. And the plan doesn't say what happens to a commission if a customer cancels within the first 90 days. Each of these becomes a clear rule in the plan document before launch.
Why edge case results become ICM test scripts
Every sample performer and edge case you build has a known input and an expected payout. That is exactly what a test script needs. When the plan is configured in your ICM system, the same cases feed functional testing and user acceptance testing (UAT), two of the eight implementation elements BHG uses on every project. Building them during design saves rework during implementation.
Watch out for: edge cases are where disputes come from
Most reps land in the middle of the curve, where most plans behave well. Disputes come from the edges: the transfer, the windfall, the clawback. Fix the design now, with a clear rule in the plan document, rather than writing an exception later. Exceptions approved one at a time tend to become precedents, and precedents become the real plan.
Method 5: What is stress testing and a shadow run in sales comp?
Stress testing puts a comp plan in front of the people who will live with it and asks them to break it, while a shadow run calculates the new plan in your ICM system next to the current plan before go-live. Together they answer the question: what will people actually do, and can the system handle it? They are the only methods that test human behavior and system configuration directly.
How to stress test a comp plan
- Gather a sales leader, a top performer, a comp admin, and someone from Finance. Each one sees the plan differently. The top performer knows where the money is. The comp admin knows which rules are hard to administer. Finance knows which outcomes would be hardest to defend.
- Ask them to maximize payout without helping the business. Give them the plan document and real territory data, and ask how they would earn more without selling more. Then close the biggest gaps they find.
This session is often the most revealing hour of the whole modeling effort. People who have carried a quota spot opportunities a spreadsheet never will.
How to run a shadow run in your ICM system
- Configure the plan in your ICM sandbox and calculate it beside the current plan for one or two periods. Use live data from the actual source systems, not a test extract.
- Compare outputs to your model and reconcile differences. Every difference has a cause: a crediting rule the model simplified, a data mapping in the ICM, or a rule that was interpreted two ways. Find each one and decide which version is right.
- If the change is significant, pilot with one team or region first. A pilot lets you test communication, reporting, and the dispute process with real reps before the whole sales team moves.
What stress testing and shadow runs reveal
In the SaaS example, the top performer in the stress test session spots the biggest gap within minutes. As drafted, a new logo is any customer account with no prior contract. A rep could sell an existing customer's expansion through a newly created subsidiary account and earn the full new-logo rate for what is really an upsell. The team tightens the definition so a logo only counts as new at the parent account level, with no revenue from that parent in the past 18 months.
The shadow run finds a smaller but important issue. The ICM's results come in about 2% below the model, because the ICM credits ramped multi-year deals at first-year ARR, as the final plan document specifies, while the model used average annual value. The ICM is right. The team updates the model, and the reconciled version becomes the cost baseline Finance signs off on.
We've been in your seat: many BHG consultants are former comp administrators, and we know the shadow run is also where admins find out whether a plan is runnable on a normal close calendar. A rule that takes two days of manual adjustment every month is a rule that will eventually be applied inconsistently. It is better to simplify it now. If you're planning a new ICM build or a significant reconfiguration, our SPM implementation services team builds shadow runs into the testing plan from the start.
Watch out for: shadow runs take time and admin capacity
A shadow run means calculating two plans for at least one full period and reconciling every difference. That work lands on the same comp admins who are closing the current period. Build it into the implementation timeline from the start, with named owners and dates, rather than squeezing it in during the last weeks before launch.
Which comp plan modeling method should you use?
No single modeling method gives the full picture: back-testing shows who wins and who loses, scenarios show the range of outcomes, Monte Carlo shows the risk, payout curve testing shows the gaps, and stress testing shows human behavior. Most plan redesigns need at least back-testing and payout curve testing. Add the others based on how much the plan changes and how much cost risk Finance can absorb.
Method | Question it answers | What it shows | Data needed | Effort | Best fit when | Main limitation |
|---|---|---|---|---|---|---|
Back-testing | If this plan had been in place last year, who would have earned what? | Who wins and who loses | 12 months of actuals by rep | Low | Every redesign, as the starting point | Assumes behavior stays the same |
Scenarios and sensitivity | What if the year goes better or worse, and which levers matter most? | The range of outcomes | Back-test or forecast as a base case | Low to medium | Finance needs a cost range; you're choosing between rates or thresholds | Moves one variable at a time |
Monte Carlo simulation | How confident are we in this cost estimate? | The risk | Two to three years of attainment history | Medium to high | Accelerators or uncapped plans; large populations; tight budgets | Only as good as the history behind it |
Payout curve and edge cases | Does the plan behave sensibly at every point on the curve? | The gaps | Plan mechanics plus realistic sample cases | Low | Every redesign, especially new thresholds, accelerators, or caps | Tests individual payouts, not total cost |
Stress testing and shadow runs | What will people actually do, and can the system handle it? | Human behavior and system readiness | The configured plan, live data, and the right people in the room | High | New measures, major plan changes, or a new ICM build | Takes time and admin capacity |
A smaller change, such as a quota reset or a rate adjustment inside the same plan structure, can usually be covered with a back-test, a few scenarios, and a payout curve check. A new plan structure, a new measure, or a new ICM platform justifies all five.
When should you model a comp plan, and with what tools?
Comp plan modeling should start during plan design and finish before plan documents are final and communicated to reps. Modeling after the plan is announced turns every finding into a reversal, and reversals cost more credibility than delays.
How long does sales comp plan modeling take?
The timeline depends mostly on data readiness, not on the modeling itself. Once performance data is clean and the plan mechanics are written down, a back-test and a payout curve check are usually a matter of days. Scenarios and sensitivity add a few more. Monte Carlo simulation takes longer the first time, because choosing and validating the distribution is real work, and much less in later years when the model can be reused.
Shadow runs set the outer limit. They require the plan to be configured in your ICM and at least one full period of results, so they need to be scheduled backward from the launch date. For a plan that starts with a new fiscal year, that usually means configuration and shadow calculation in the last quarter of the current one.
Can you model a sales comp plan in Excel?
Yes, for most of the work. A well-structured spreadsheet handles back-testing, scenarios, sensitivity, and payout curves for most sales teams. Monte Carlo is possible in a spreadsheet but slow and hard to audit at scale, so teams with large populations or complex plans often move it to a statistical tool or to the modeling capability in their SPM platform.
Whatever the tool, two practices matter more than the software. Keep the plan mechanics in one place so every method uses the same rules, and keep a log of every assumption. When Finance asks why the 90th percentile cost moved, the assumption log is the answer.
If you're still deciding how the plan should be structured, our sales compensation plan design and advisory services cover design and modeling together. If you want modeling and comp cost forecasting built into your ongoing operations, see our approach to sales performance forecasting.
What should you do after the plan launches?
Compare actual results to the model every quarter. Look at total cost against the median and 90th percentile, the winner and loser pattern against the back-test, and every edge case that came up against the rules you wrote for it. Record where the model was right, where it was wrong, and why.
That quarterly comparison does two jobs. It gives Finance early warning if cost is trending toward the tail, and it means next year's design starts from evidence, not memory. Your incentive compensation management (ICM) system already holds most of the data you need; the discipline is in reviewing it on a schedule.
Frequently asked questions about comp plan modeling
How do you test a sales compensation plan before rolling it out?
Test a sales compensation plan by back-testing it against last year's actual results, running upside and downside scenarios, checking the payout curve and edge cases, and calculating it in your ICM system beside the current plan for one or two periods. For plans with accelerators or tight budgets, add a Monte Carlo simulation to estimate the probability of exceeding budget.
What is a Monte Carlo simulation in sales compensation?
A Monte Carlo simulation in sales compensation runs a comp plan thousands of times against randomly generated attainment for every rep, based on the shape of your historical results. Instead of one cost estimate, it produces a range: the median cost, the 90th percentile cost, and the probability that the plan exceeds budget.
What is the difference between a shadow run and shadow accounting?
A shadow run is a planned test: the new plan is calculated in the ICM system next to the current plan before go-live, and the results are reconciled. Shadow accounting is a symptom: reps or managers keep their own spreadsheets to check their pay because they don't trust the official numbers. Good modeling, including a shadow run, helps prevent shadow accounting.
How much historical data do you need to model a comp plan?
You need at least 12 months of actual performance by rep for every plan measure to run a back-test. Monte Carlo simulation works best with two to three years of attainment history, adjusted for any changes to territories, roles, products, or quota methods since that history was recorded.
Make sure your plan is ready before it goes live
Modeling tells you whether your plan design will work. The next question is whether your data, your ICM configuration, and your team are ready to run it. Talk to a BHG SPM specialist to get an implementation readiness assessment.
About the author: Elizabeth Evans, CSCP, PMP, is a consultant at Blue Horizons Group, where she works on sales compensation governance, plan design, and ICM implementations on Varicent, Xactly Incent, and CaptivateIQ. Before BHG, she managed incentive programs in-house for a Fortune 500 company, and she teaches WorldatWork CSCP certification prep courses. Connect on LinkedIn.